
Thinking tool
Looks conclusive. It isn't.
A speed-limit chart and five questions for checking numbers. Especially when you like what they say.

A chart I found in a LinkedIn post on 13 October 2026: six countries with motorway speed limits, each displaying a higher value than Germany. The heading counts deaths per 1,000 kilometres of motorway. Germany appears at the end with 30.2. The post concludes that the safety argument for a general speed limit does not stand up to scrutiny.
The image looks like an answer. Before deciding about speed limits, though, I need to answer a different question: what do these numbers actually show?
My assessment: the chart does not justify its conclusion. It omits its source and data year, selects countries on one side of Germany, and uses a measure that leaves out traffic volume. This tells me nothing about the intentions of the person sharing it. It does give me a reason to reject the claimed proof that speed limits have no safety benefit.
These five questions also work for other posts containing numbers. They are a practical tool, not a promise to detect every deception in five steps.
1. Where does the number come from, and what year is it for?
The chart names neither its source nor its year. I compared its seven values with Eurostat’s series for motorway length and deaths on motorways. Three rounded values match 2016: Germany, Italy and Poland. That makes 2016 a useful year to check. It does not establish that the chart uses it. The other four values do not match the same data basis.
Slovakia is a clear example. The chart says 33.7. For 2016, Eurostat records eleven deaths and 463.2 kilometres of motorway. Eleven divided by 463.2, multiplied by 1,000, gives 23.7. Germany’s 393 deaths and 12,996 kilometres give 30.2. On that shared basis, Slovakia is below Germany.
This is a discrepancy with the year checked. Because the chart’s year remains unknown, it does not prove that the number was invented. The post simply lacks the information needed to trace it. Sources: Eurostat deaths by road type and motorway length, my calculation; data checked on 13–14 October 2026.
The practical question is: can I follow the path from the source to the number? A source name alone may not be enough.
2. What has been left out?
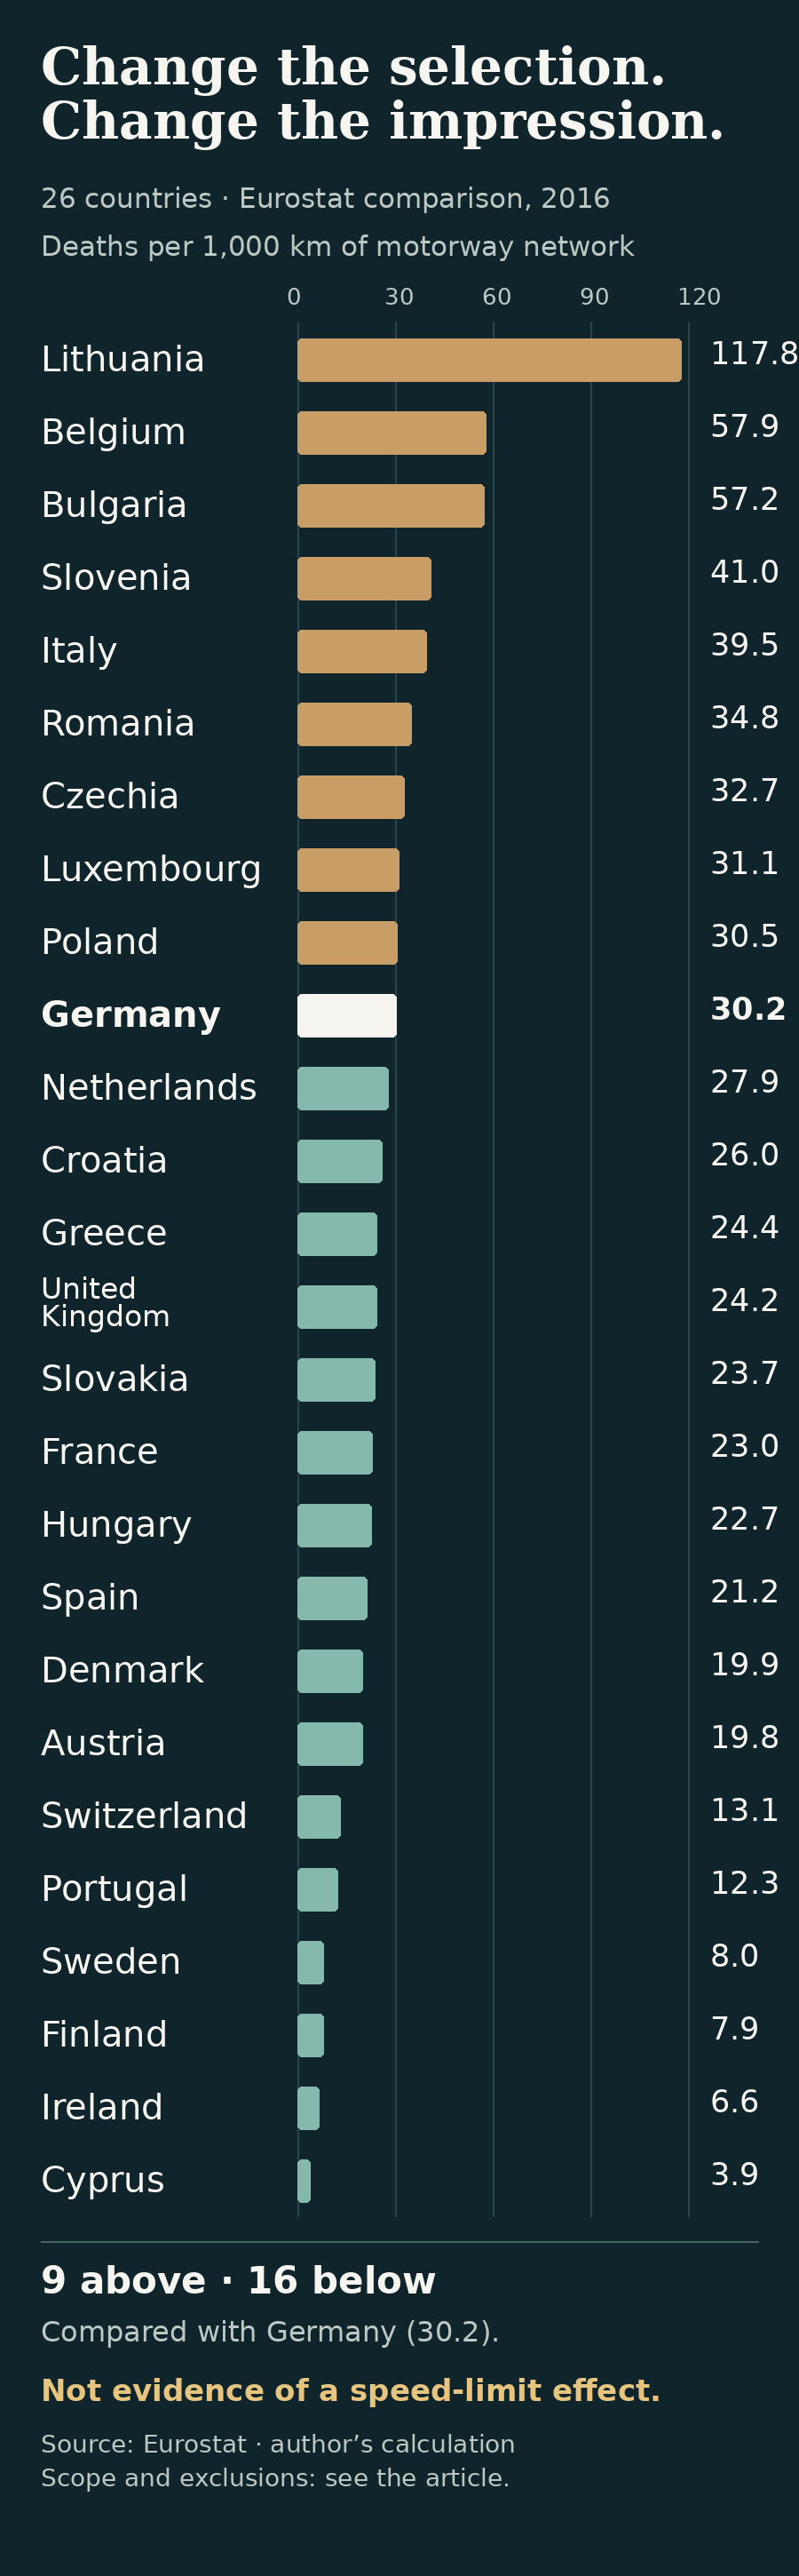
The chart shows only countries whose displayed values are above Germany’s. None below it appears. In my extended Eurostat calculation for 2016, nine comparison countries were above Germany and sixteen below. I included available series from the EU, EFTA and the United Kingdom, excluding countries without a usable combination of motorway length and deaths. Zero reports for Norway and Estonia were excluded because data completeness was unclear; I did not interpret them as reliable zero risks.
The table includes all 26 countries in that 2016 calculation, including Germany. Its ordering makes the selection question visible. It does not measure the effect of speed limits.
| Country | Deaths per 1,000 km of network |
|---|---|
| Lithuania | 117.8 |
| Belgium | 57.9 |
| Bulgaria | 57.2 |
| Slovenia | 41.0 |
| Italy | 39.5 |
| Romania | 34.8 |
| Czechia | 32.7 |
| Luxembourg | 31.1 |
| Poland | 30.5 |
| Germany | 30.2 |
| Netherlands | 27.9 |
| Croatia | 26.0 |
| Greece | 24.4 |
| United Kingdom | 24.2 |
| Slovakia | 23.7 |
| France | 23.0 |
| Hungary | 22.7 |
| Spain | 21.2 |
| Denmark | 19.9 |
| Austria | 19.8 |
| Switzerland | 13.1 |
| Portugal | 12.3 |
| Sweden | 8.0 |
| Finland | 7.9 |
| Ireland | 6.6 |
| Cyprus | 3.9 |
Source and calculation as above. Deaths per 1,000 kilometres of motorway network, 2016, rounded to one decimal place. A single crash can substantially change the rate for a small network. This table also has limits imposed by available and excluded data.
More countries below Germany do not prove that speed limits caused the difference. A longer list can contain the same reasoning error as a short one. Here it establishes something narrower: changing the selection changes the impression.
3. What is the denominator?
A kilometre of road is not a kilometre driven. Two motorway networks of the same length may carry very different amounts of traffic. More people may die on the busier network even if the risk per kilometre driven is lower.
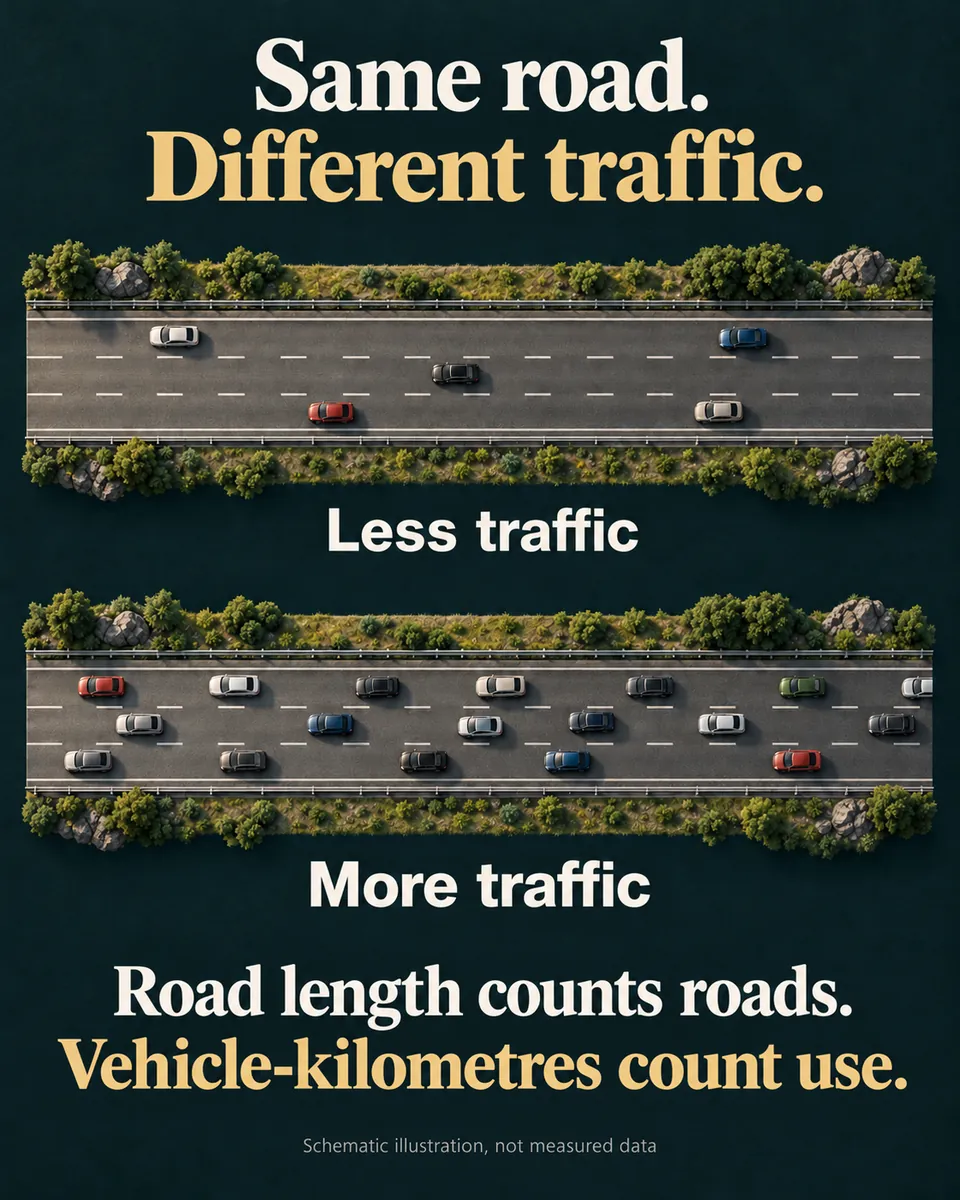
Deaths per vehicle-kilometre therefore answer a different question from deaths per kilometre of motorway network. For the full list of countries, I have not checked a harmonised comparison per vehicle-kilometre using the same year and definition. A few conveniently selected rates would not fill that gap.
The denominator question also applies to supporters of speed limits. Germany’s statistical office reported for 2018 that 71 per cent of motorway deaths occurred on sections without speed limits. Around 70 per cent of the network was unrestricted. Without traffic volume for each type of section, these proportions do not allow me to calculate a safety effect. They prove neither a benefit nor its absence.
Ask: what are we counting per, and does that denominator fit the question?
4. Does the difference establish the claimed cause?
Countries differ in more than their speed limits. Roads, traffic volume, vehicle mix, enforcement and actual speeds also vary. A ranking does not separate these influences. It cannot establish either that speed limits save lives or that they achieve nothing.
That requires studies designed to account for such differences. Their results still have limits. A statistical method does not automatically turn observational data into an experiment.
The overall picture from my research points more towards a safety benefit from lower speeds and limits. The precise nationwide effect of a general limit in Germany today remains uncertain. International evaluations concern different roads, periods and policies; they do not produce a shared percentage for Germany. My research also includes mixed or statistically inconclusive findings. I have not personally checked every historical and international original. This assessment of the direction of the evidence is therefore not a complete systematic literature review.
Two German approaches show why their estimates need to be read separately:
A model calculation: The German Bundestag’s research service, WD 5-108/22, pages 14–15 describes a range of 15 to 47 per cent fewer deaths on previously unrestricted sections under a 130 km/h limit. Its assumptions include a five to ten kilometre-per-hour reduction in actual speeds. The range comes from different model assumptions. It is neither a confidence interval nor a measured nationwide introduction effect.
A local observational study: In Mandatory speed limits and crash frequency on motorways, 2025, Maike Metz-Peeters studies German motorway sections using crash data from 2017–2019. For 120 km/h limits, the final paper’s Table 4 estimates roughly 35 per cent fewer fatal crashes and 26 per cent fewer serious crashes per section. These are crash counts, not directly counted people saved nationwide. Statistical uncertainty and assumptions about the selection of restricted sections matter.
The study accounts for observed road characteristics. Its conservative interpretation additionally assumes that unobserved hazards make a section more likely to receive a limit. The algorithm does not remove uncertainty about that assumption. For 130 km/h, the estimated fatal-crash rate reduction in the same table is not statistically established at the conventional five-per-cent level. This does not establish no effect. It does limit confidence in a precise claim about 130 km/h.
The paper’s nationwide extrapolation is conditional too. It translates local estimates to previously unrestricted sections; a general rule may work differently from local signs. I checked the final main paper, not its separately published supplement, code or an independent reproduction. A model, main paper, earlier version and press release are therefore not four independent confirmations.
5. Would I accept this from the other side?
For me, this is the uncomfortable question. Would I accept a missing source if the number supported my position? Would I share a favourable selection of countries? Would I turn a local study into a certain national forecast?
My first country count also needed correction. The result depended on the countries selected, and I had described the scope of the shared chart imprecisely. The revised calculation is part of the result. Correcting an error improves a check; it does not make the person checking infallible.
Applying the same standard does not mean treating all sources or political camps as equally reliable or dangerous. It means explaining differences with evidence. Blanket distrust is no more useful here than blind trust. Conspiracy narratives, populism and extremism deserve challenge, not a discount under the label of questioning things.
What I take from this chart
My position: the chart is misleading as an argument against a safety benefit. Its conclusion is unsupported because of its selection, denominator and missing causal comparison. I do not need to attribute intentions or turn an opposite country ranking into proof.
Whether a speed limit is politically justified also requires a value judgement: how do we weigh avoidable harm, freedom and the other consequences of a rule? Research informs that judgement. It does not make it for us.
For the next post containing numbers, I will ask: where from and when? What is missing? Per what? Which cause has actually been tested? And would I accept the same conclusion if it challenged my position?
Written with support from generative AI. Editorial responsibility: Marcus Machon.
Which question will you take with you?
Bring your perspective →